

The Spring Hunter’s Way

As a trader, I’ve tried many things in the markets. Familiarized myself with different trading strategies and methodologies to come to my favorite. Scalped bar-by-bar candlestick patterns. Looked for day trading harmonic patterns. Traded Stochastic divergences, and basic price action figures. Then I’ve made it as simple as possible with the Spring trading setup. It is one of the more relaxed setups that can be traded in almost any time frame. My preference is the 30-minute or the 1-hour charts. Those of you who like shorter-term trading won’t be disappointed. It works on the 15-minute chart and appears very often in the 5-minute one as well. However, the noise there makes it not that clear to enter at the right candle. So for new traders, my advice is to stick to the longer-term charts till you get your grasp on it.
Seasoned traders probably already heard the term Spring or maybe Upthrust. Especially when they stumbled upon the work of no other than Richard D. Wyckoff. He was a stock market authority in the early 20th century. His method aims to identify potential market trends, reversals, and the manipulation of large institutional investors. Traders utilizing the Wyckoff method often rely on volume analysis, price action, and the interplay between supply and demand to make trading decisions. They study the behavior of the market participants, looking for signs of accumulation (indicating potential price increases) or distribution (indicating potential price decreases). In my humble opinion combining the price action with the volume confirmation can increase the hit rate. This matter on its own is quite subjective and discretionary and can take a while to master.
The origin – How I’ve discovered this trading setup
Despite maybe Wyckoff being the originator of the Spring and the Upthrust during the same time, Gann was trading a similar one. Who of them was the father of that setup is not that important to me. The person from whom I know this trading setup and who had a great influence on my trading was our dear Dr. David Paul. A remarkable person, one of the greatest presenters I had the pleasure to hear. A trader and mentor who taught so many of us ‘how to play that game, over and over and over again’. It was Dr. David Paul who researched Gann’s work extensively and produced this simplified Spring trading system. You might have found it as the lost motion, lost momentum, fishing technique or just trading double tops and bottoms. For the price action person, it might appear to simply be buying double bottoms in up markets and selling double tops in downtrends.
‘It’s all a matter of interpretation.’
Dr. David Paul
This blog would probably have never appeared if it were not for the influence of David Paul. He sadly passed away last year, but I hope his legacy will stay and this is my attempt to retain his teachings.
The Spring trading setup unveiled
Now for the setup itself. What of a Spring Hunter am I if I don’t show you what the Spring is?
First of all, when you hear Spring – think of going long. When you hear Upthrust – think of Selling the market. Ultimately these are the same thing and mirror images of each other. As per Dr. David Paul, the short version is the more reliable one. Especially when combined with volume it has a remarkable ability to predict when prices might drop off like a brick. All of you who stared at the financial markets for some time know that the price falls much more rapidly than it increases. Therefore it typically takes less time for your targets to be reached when short-selling. This is a phenomenon that can be explained by the trading psychology of the masses. Fear is stronger than greed.
Explaining it is much more simple using a picture. Below you have a textbook Spring that occurred in the forex market:

Schematically the price breaks an old resistance level (the blue horizontal line), then it pulls back and ‘kisses’ this previous price level once. Tries to resume its initial direction, but loses momentum and fails once. Then pulls back below the previous low, takes all those logical stops there, and reverses aggressively from there in the main trend direction. My preference is to look for Springs in an already established trend and look for Upthrusts in downtrends. For trend direction and filter, I simply use moving averages. Mine are 10 EMA, 21 EMA, 55 EMA, and 89 SMA/EMA. Pick the ones that work best for you. You just need a short-term, mid-term, and longer-term moving averages.
Trading it with other confluences
You can trade this setup fairly mechanically. I prefer to use some discretion to raise my odds of success. Therefore pointing out a few confluences that make this particular example interesting:
- Good entry bar in the form of a bullish Hammer. Others call it a Pin bar. Its wick or shadow is 3 times bigger than the body. The fans of technical analyses and candlestick patterns know it should be 2 times bigger than the body, but this is the Forex market so I’d like it to be at least 3 times bigger. I typically wait for the price to close above the previous low, but the entry bar was just fine for a trigger.
- Enthusiasts of harmonic patterns will spot that this was an AB=CD pullback. It worked out to the tick! It is not always that perfect, but I often use the 1 to 1 measured move to anticipate where the price might reverse.
- Fans of Lane’s Stochastic and any other divergence trading systems will see that this particular Spring occurred during a Reverse Divergence (also known as Hidden Divergence). It adds up to the probability and makes this setup an A+ in my book.
- On the left side of the picture, you can see an Upthrust in action. indicated by the red down arrow. It was not exact AB=CD, but the price took the previous high and reversed with a pin bar (although not that perfect ). This level was the resistance level that then turned to support for our Spring.

Correlation in the markets – simultaneous excellent risk reward trades
Something you can’t see in the previous picture alone, but is very often observed with this pattern is that it occurs very often at the same time in multiple instruments. In this case in multiple forex pairs all at once. The same happens in stocks and indices – especially in the main ones like DOW, DAX, NASDAQ, and SP500. They are all highly correlated. There are days when at the same time you have 5 Spring opportunities and you must then pick the best one. How to pick the best pair or stock is a topic for another discussion.
During the same time when the EURJPY Spring occurred, we had another almost perfect one in the 30-minute chart of GBPJPY:

Again an AB=CD harmonic pattern. Excellent bullish pin bar for entry. Stochastic near the oversold zone. And as David Paul beautifully said:
‘It’s not called a spring for nothing – when it goes it goes’
Notice how the price reacted from the 161% Fibonacci extension level. It is often used for a target by many traders hence its self-fulfilling predictive power. After this small reaction price kissed the previous low once and formed what Richard Wyckoff calls a ‘sweet spot’. Notice that no previous support was visibly broken (unless you go on the lower timeframes). I have specifically observed that if the Spring or Upthrust happens in a pullback at around the 38% Fibonacci retracement levels I am eager to take them even without a clear previous support or resistance level. But then the target should be around the 261% Fibonacci extension level to make sure you have a sufficient risk-reward ratio for a swing trade. Below 1:2 risk-reward ratio, you have no swing trade. Preferably you should aim for 1 to 3.
Another correlated forex market example
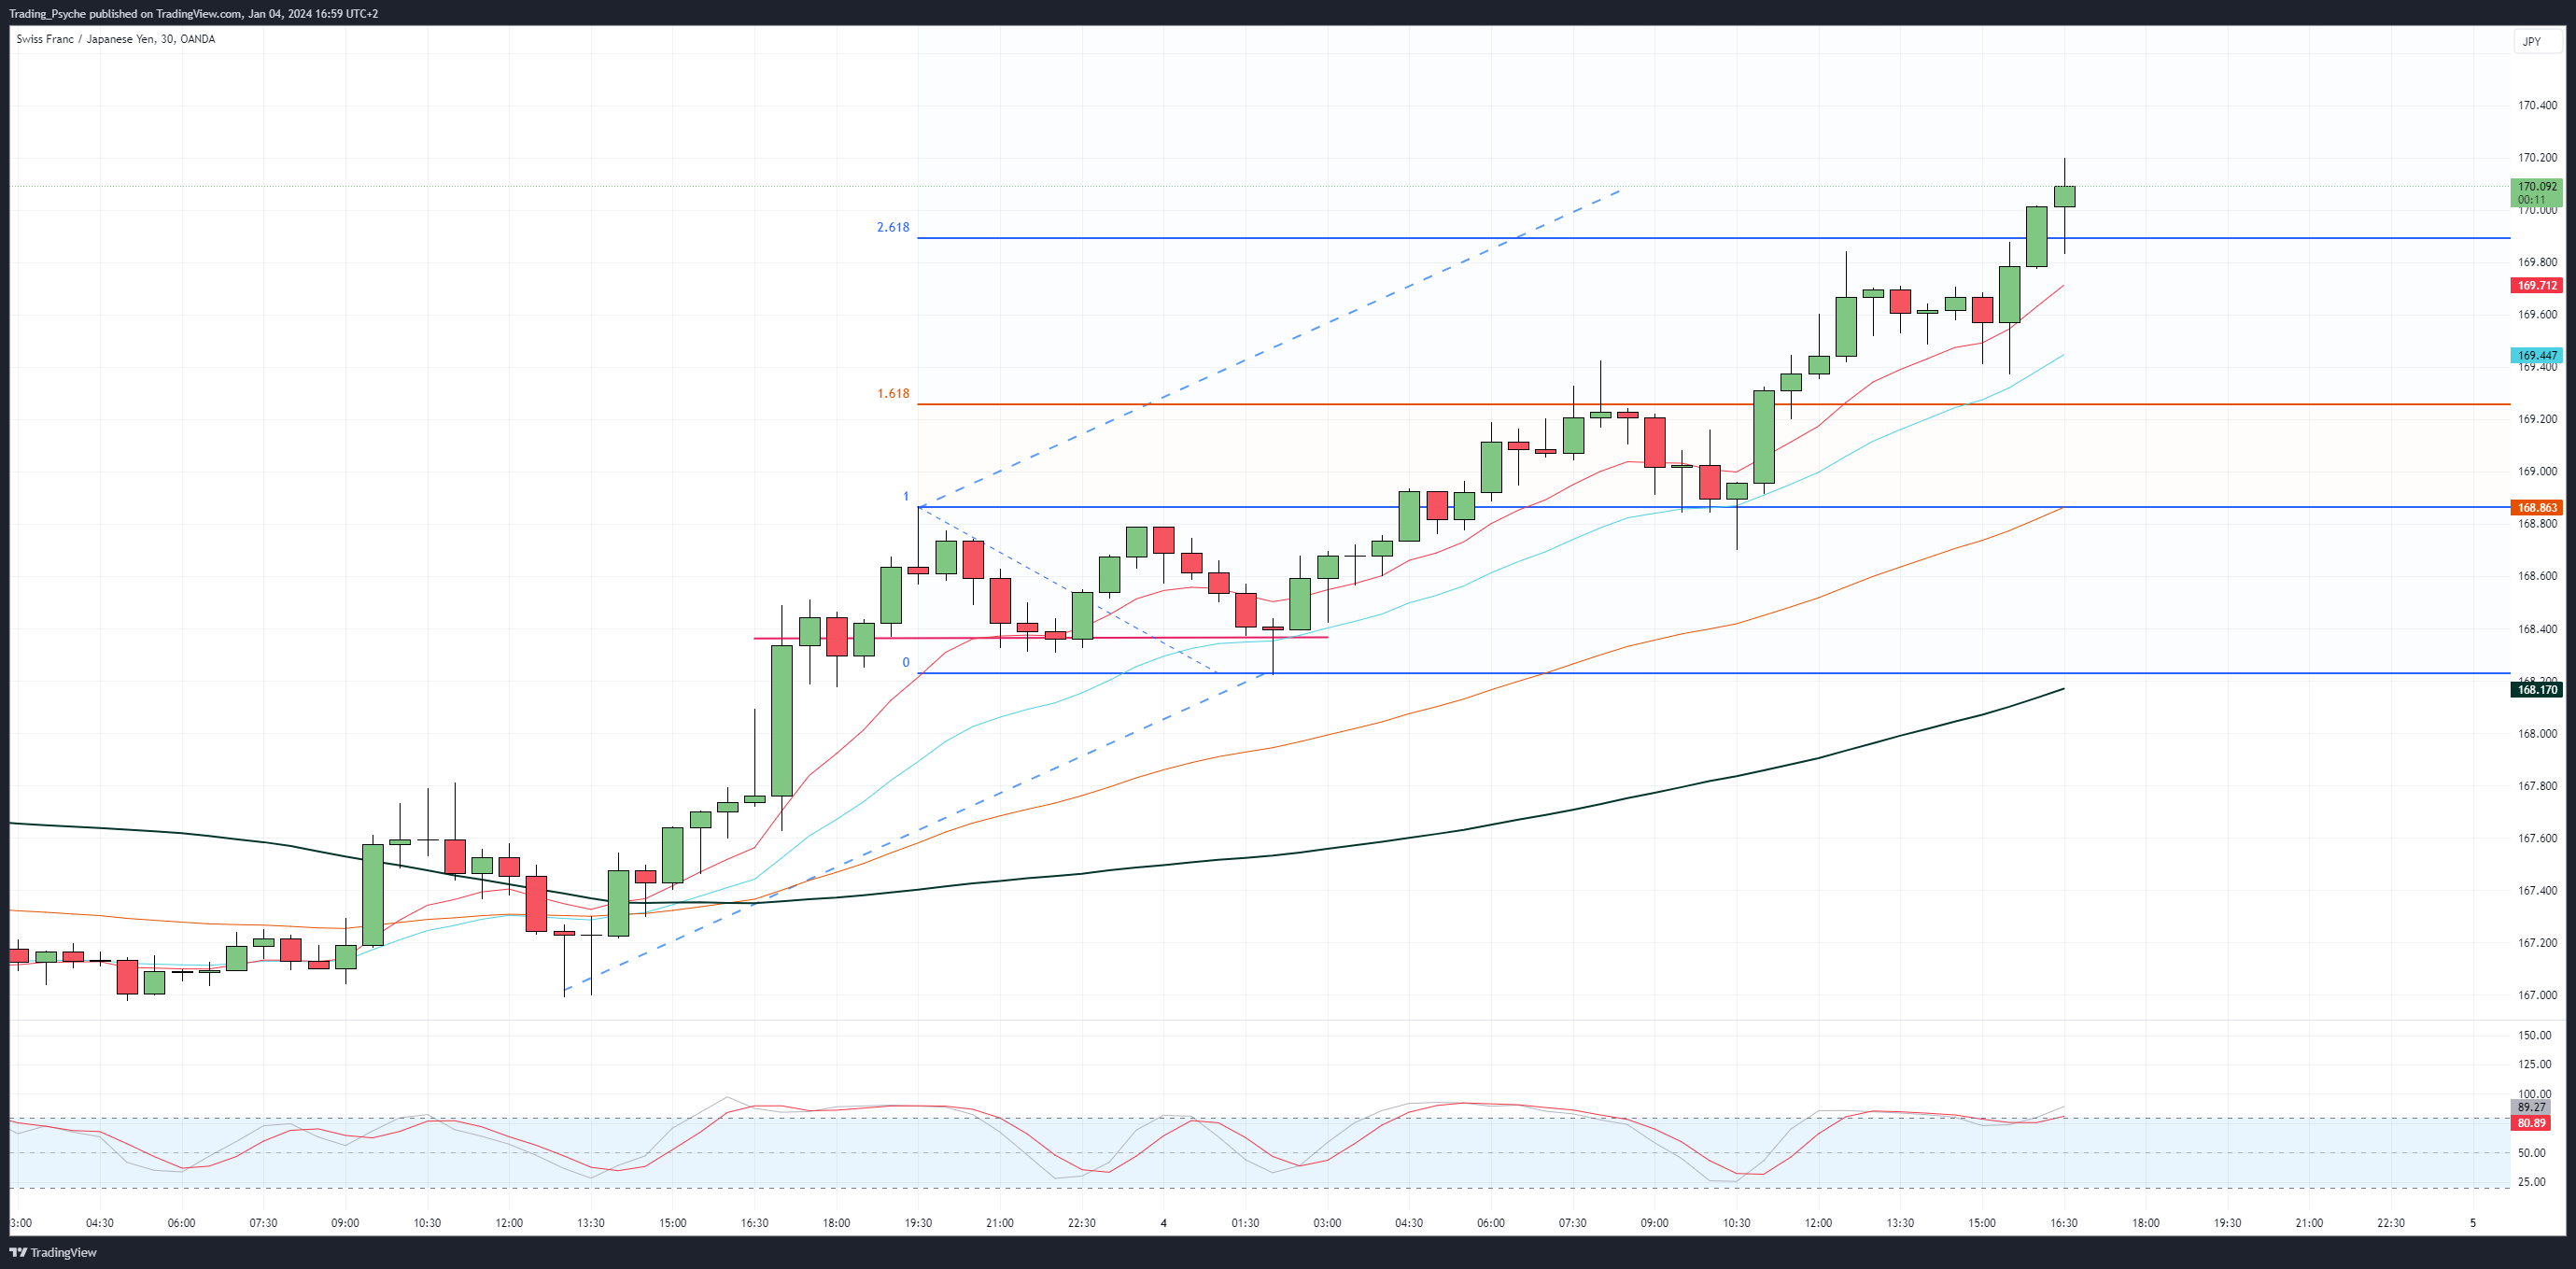
Over time you will learn to spot these. Here are 2 more Forex pairs when we had a Spring setup cooking at the same time.

The Upthrust trading setup – the short mirror image
As an end, I will show you just the mirror image which is the Upthrust. It is a Short setup.

After the Upthrust the price bounced a little again from the 161% Fibonacci extension level. Then it ran to the 1 to 1 price action target (marked by the red dotted line). That level can be used for a longer-term target.
I you want to know more about that: Larry Pesavento wrote extensively on the topic of harmonic patterns.
Summary and a trading exercise
Hope this was a good enough start for now. It will take you a day or two to start spotting them, but I assure you they occur all the time. What I like about them is that I can use alarms to catch them without staring at the charts all day long.
Some traders call this a Spring. Others will see an AB=CD. On specific occasions, it might represent the harmonic Gartley 222 pattern. Especially if the pullback was deep to the 61% or 78% Fibonacci retracement levels. Others will call this trading setup a Double Bottom in an uptrend or a Double Top in a downtrend. You may also see this as simply buying support and selling resistance. It’s mostly a matter of interpretation. As Jessy Livermore said so well in ‘Reminiscence of a Stock Operator‘:
‘There is nothing new in Wall Street. There can’t be because speculation is as old as the hills. Whatever happens in the stock market to-day has happened before and will happen again.’
Just don’t forget the technical setup is only a part of what makes this a successful trading strategy.
One exercise I want to leave with you:
Open any charting software you have available. My preference is TradingView since the free charting package is excellent and the volume is quite accurate. Also, it’s simple for scanning and I often use the bar replay functionality for backtesting. Whatever your choice might be – go and find previous support and resistance levels. Then observe how the price reacted there.
When did the best risk-to-reward trades occur? Where were people trapped? Look for what repeated over and over again.
Stay tuned and subscribe to receive the next post.
Yours truly,
The Spring Hunter

Very well written article and explained the strategy! Just like you, interested to trade Forex, found Tom Hougaard videos on YouTube about trading psychology. In his videos I discovered about his good friend David Paul (RIP), who introduced to masses in a very simple manner this amazing strategy.
How it is working you so far?
Hey Max, thanks so much for this comment. Happy you liked it! Yes, David was a great man, a really supportive first-class fellow. So about the strategy: depends on how you do the trade management. If you take half at 1 to 1 and put a stop to BE you may get 60-70% hit rate only on these (I say may as this is optimal, it can fall to 50%, depending on the symbol – some FX pairs are noisy and choppy. Here some discretion is needed – if the price is low volume or too choppy – stay alay or go higher timeframe). With this strategy, you often have good odds to get 1 to 1 as the place of the spring is a trap so enough move for scalpers. But if you close half even with 60-70% hit rate you are either barely breakeven or you still lose in the long run. So the trick is to let the second piece move and it should move far. What far means for me? If you close the runner at the previous high – your result will probably be just a bit in the profit zone after 100 trades. From what I’ve seen so far – Less than 20% of the trades will be runners, but will make more return than all of those halves. 3-4 trades per 100 will be those 5-7R winners (remember the second half is a half size so we speak about 10-14 R move) which will make 1/3 of the return of all runners. David was quoting 30% for runners, but I think you can do that in stocks where you have some fundamentals – this is why lately I am a bit shifting to stocks and longer-term swing trades (not enough data to tell you how it is) . So to summarize, take your halves – protect the stop and set the runner and forget it unless it reaches some longer 1 to 1 target or the 161% extension – the less you manage the better. The more I managed the more mediocre results I had.
Enough writing here – the next post or video actually will be for you. 🙂 One way or the other I was planning to do some backtests and share some of the content here. What you can do – take the Spring and do 100 trades random backtest in some of the indexes or forex but with 30-1h candles at least. Whatever I say you have to feel it for you. People say you need more than 100 (I agree), but if a strategy doesn’t produce anything in 100 trades I doubt many people will stick to it.
By the way Max, how did you find the blog? It’s still pretty green so interested in how people discover it.
Thank you for your reply and advice!
Recently, like I mentioned, I discovered the David Paul trading wisdom and his most used strategies, so I Googled “Spring wyckoff david paul” and your blog is on the first page, that’s how I found your Blog! Keep the good work!
Wow, that is pretty amazing. One of the reasons I’ve created this is to share the wisdom left from David so that really made my day.
I hope you’d enjoy this one, created it for you and the rest readers who had questions:
Deep dive into the Wyckoff Spring and Upthrust + Video at the end
Pingback: Deep dive Wyckoff Spring and Upthrust + Video in the end
Great work!